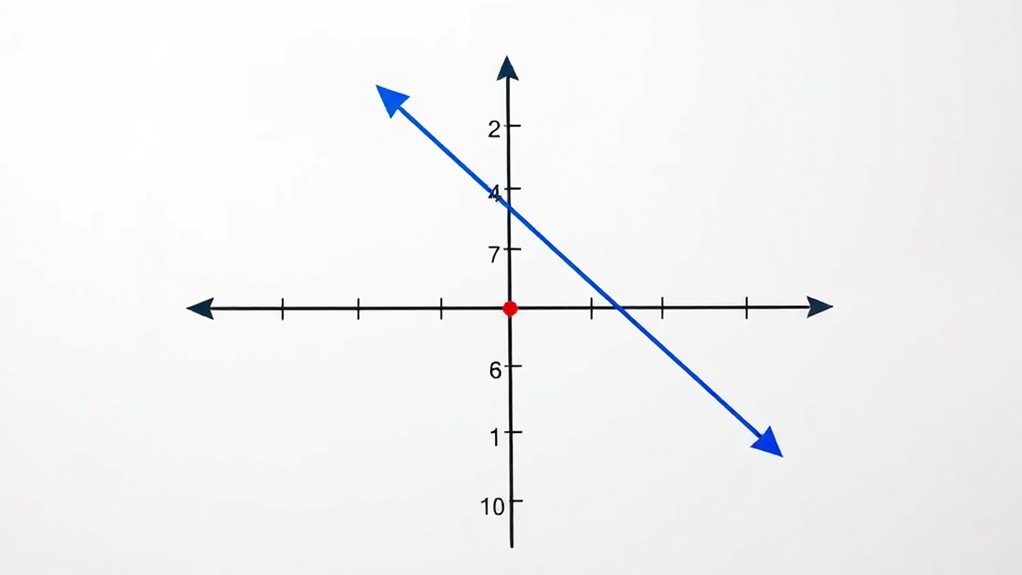
Understanding the slope and intercept helps you see how variables change together in a linear equation. The slope shows how steep the line is and indicates the rate of change; positive slopes mean both variables increase, negative slopes mean one decreases as the other increases. The intercept is where the line crosses the y-axis, representing the starting value. By exploring these concepts further, you’ll gain a clearer picture of how to interpret and graph linear relationships.
Key Takeaways
- The slope (m) indicates the rate at which y changes with x, showing the line’s steepness and direction.
- The y-intercept (b) is where the line crosses the y-axis, representing the initial value when x is zero.
- Rewrite equations in slope-intercept form (y = mx + b) to easily identify slope and intercept.
- The slope’s sign shows whether the line inclines (positive) or declines (negative).
- Graphing involves plotting the y-intercept and using the slope to find additional points.
What Is the Slope of a Line?

Have you ever wondered how to measure how steep a line is on a graph? That’s where the slope definition comes in. The slope tells you how much the line inclines or declines as you move from left to right. It’s a number that represents the line’s inclination, showing whether it goes up, down, or stays flat. Fundamentally, the slope is the ratio of the vertical change (rise) to the horizontal change (run) between two points on the line. If the slope is positive, the line inclines upward; if negative, it declines downward. A zero slope means the line is horizontal. Understanding the slope helps you interpret the behavior of the line and how it relates to the data it represents. The concept of slope is also fundamental in understanding Fokos and other mathematical concepts related to linear equations.
How to Find the Slope From an Equation

To find the slope from an equation, start by rewriting it in slope-intercept form, y = mx + b. Make sure to identify the coefficients clearly, especially the number in front of x. Once you do that, you can easily calculate the slope value as the coefficient of x.
Rearrange Equation Form
When you want to find the slope of a line from its equation, the key is to rewrite the equation into slope-intercept form, which is y = mx + b. This involves equation manipulation, where you isolate y on one side. By doing so, the coefficient of x becomes the slope, making it easier to interpret through graph interpretation. If your original equation isn’t in this form, move terms around—subtract or add as needed—until y is by itself. Once in slope-intercept form, you can clearly see the slope value, which tells you how steep the line is. Rearranging equations like this simplifies understanding the relationship between x and y and allows you to analyze the line’s behavior directly from its equation.
Identify Coefficients Clearly
Finding the slope of a line from its equation is straightforward once you identify the coefficients clearly. The coefficients’ significance lies in determining the slope, especially the variable coefficients associated with the x-term. In a linear equation, typically written as y = mx + b, the coefficient of x is the slope. To identify it, look for the number multiplying the variable x. Remember, the variable coefficients directly influence the line’s steepness and direction. Sometimes, the equation isn’t in standard form, so you’ll need to rearrange it to see the coefficients more clearly. Recognizing these coefficients helps you quickly find the slope without confusion, making your understanding of linear equations more precise and efficient. Additionally, understanding how Honda Tuning modifications can influence vehicle performance can be related to how adjusting coefficients in an equation affects the line’s behavior.
Calculate Slope Value
Calculating the slope from an equation involves identifying the coefficient of the x-term directly from the given formula. To do this, start by rewriting the equation in slope-intercept form (y = mx + b) through equation transformation. This step makes it easier to see the slope value, which is the coefficient of x. When analyzing a graph, you can verify the slope by examining the steepness between two points. For equations not in slope-intercept form, rearrange terms to isolate y and x. Once in this form, the coefficient of x is your slope. This process streamlines graph analysis, helping you understand the line’s inclination precisely. Knowing how to calculate the slope from an equation enhances your ability to interpret and work with linear relationships effectively.
Interpreting the Slope in Real-World Contexts

Understanding the slope helps you see how quickly one thing changes relative to another. By exploring real-life examples, you’ll see why the rate of change matters and what different slope values mean. This insight makes it easier to interpret data and make informed decisions. Notably, the financial impact of entertainment industries like WWE Raw demonstrates how revenue streams can influence global markets.
Rate of Change Significance
The slope of a line reveals how rapidly a quantity changes over time or with respect to another variable. It’s essential for understanding the rate change and performing trend analysis. A positive slope indicates an increasing trend, while a negative slope shows decline. To interpret the significance of this rate:
- Recognize whether the rate of change aligns with expectations or signals anomalies.
- Use slope magnitude to compare the speed of different processes or variables.
- Apply slope insights to predict future behavior based on current trends.
- Remember that a best vacuum model tested for suction power and filtration efficiency can provide reliable data for assessing performance trends. Understanding the rate of change helps you grasp how quickly things evolve and whether a trend is sustainable. This knowledge is crucial for making informed decisions in fields like economics, health, and engineering. Ultimately, it deepens your capacity to interpret real-world data effectively.
Real-Life Examples Explored
Have you ever wondered how data trends translate into real-world decisions? In coordinate geometry, the slope reveals how one variable changes relative to another, providing insight into practical situations. For example, if you’re analyzing the relationship between hours studied and test scores, the slope tells you how much scores improve with each additional hour. Algebraic expressions help you model these relationships precisely. Understanding the slope in context allows you to interpret whether a trend is positive or negative and how strong that trend is. This approach helps in fields like economics, biology, or business, where decision-makers rely on linear models to predict outcomes. Recognizing the importance of linear equations further enhances your ability to analyze and interpret data effectively. By exploring these real-life examples, you see how the slope isn’t just a number but a meaningful indicator of change in everyday situations.
Interpreting Slope Values
When you see a slope value in a linear model, it directly shows how one variable changes in relation to another. The slope represents the rate of change between the variables. A positive slope indicates that as one variable increases, the other also increases; a negative slope shows the opposite. To interpret the slope effectively:
- Consider the units—this tells you how much the dependent variable changes per unit increase of the independent variable.
- Evaluate the steepness comparison—steeper slopes mean faster changes, while flatter slopes indicate slower changes.
- Understand the real-world impact—whether it’s a rise in sales per advertising dollar or a decrease in travel time per additional road lane, the slope clarifies the relationship’s significance.
- Be aware of affiliate disclosures when reviewing data sources or promotional content related to your analysis.
Understanding the Y-Intercept and Its Significance

Understanding the y-intercept is essential because it reveals where a line crosses the y-axis on a graph. This point shows the starting value of your equation when x equals zero, highlighting the y intercept significance. In equations, the intercept in equations indicates this crossing point, giving you insight into the data’s baseline. Here’s a visual to clarify:
| X Value | Y Value | Notes |
|---|---|---|
| 0 | b | Y-intercept, point where line crosses y-axis |
| Positive | Slope * X | Y-values increase with X |
| Negative | Slope * X | Y-values decrease with X |
| Zero | b | Y-intercept location |
| Any | Varies | Overall line behavior |
Knowing where your line hits the y-axis helps interpret data trends and the intercept in equations. Additionally, understanding the importance of the y-intercept can aid in analyzing how initial conditions influence overall outcomes.
How to Identify the Intercept From an Equation

Want to quickly find the intercept from an equation? Start by examining the linear model, usually written as y = mx + b. The intercept is where the line crosses the coordinate plane’s y-axis. To identify it:
- Look at the constant term in the equation, which is the value of y when x equals zero.
- Recognize that this value represents the y-intercept directly.
- For the x-intercept, set y to zero and solve for x, revealing where the line crosses the x-axis.
Knowing how to identify the intercept from the equation helps you visualize the line’s position on the coordinate plane. This approach simplifies understanding the relationship between the algebraic form and the linear model’s graph.
Graphing Linear Equations Using Slope and Intercept

To graph a linear equation quickly and accurately, start by plotting the y-intercept on the coordinate plane. This point is where the line crosses the y-axis and gives you a solid starting location. Once you’ve marked the y-intercept, use the slope to find another point. The slope tells you how many units to move vertically and horizontally from your starting point—rise over run. For example, if the slope is 2, you go up 2 units; if it’s -1/3, you go down 1 and right 3. Plot the second point using this rise and run, then draw a straight line through both points. This method works well for graphing linear functions quickly and accurately, helping you visualize the relationship between variables. Incorporating home decor & design concepts can make your workspace or study area more inspiring and conducive to learning.
The Relationship Between Slope and Line Steepness

Have you ever noticed that some lines on a graph are steeper than others? The slope directly affects the line’s steepness, impacting how you interpret the graph’s meaning. A larger slope means a steeper line, indicating rapid change, while a smaller slope suggests a gentler incline. When considering slope stability, steeper lines may be more sensitive to data variations, affecting the line curvature and overall stability. To deepen your understanding, consider these points:
- Steeper slopes often reflect more significant changes in data over short intervals.
- Variations in slope influence line curvature, affecting how smoothly the line progresses.
- Slope stability can be impacted by measurement accuracy, especially with highly steep lines.
- Hackathons provide an excellent environment to explore complex data analysis and visualization techniques that enhance understanding of such relationships.
Understanding this relationship helps you recognize how line steepness shapes data interpretation.
Common Forms of Linear Equations and Their Components

Linear equations are fundamental tools for representing relationships between variables on a graph. They are often expressed in common forms that highlight different equation components. The slope-intercept form, written as y = mx + b, clearly shows the slope (m) and the y-intercept (b), making it easy to interpret how the line behaves. The standard form, Ax + By = C, groups the variables to facilitate certain calculations and analyses. Additionally, point-slope form, y – y₁ = m(x – x₁), emphasizes the slope and a specific point on the line. Understanding these forms helps you identify key components of linear models quickly. Each form offers unique advantages, aiding you in analyzing and graphing linear relationships efficiently. Recognizing equation components is essential for interpreting and applying linear models effectively.
Practical Applications of Slope and Intercept in Everyday Situations

Understanding how slope and intercept work in real life can help you make better decisions and solve common problems. For example, in graph interpretation, recognizing the slope helps you predict future trends, like sales growth or temperature changes. Algebraic manipulation allows you to rearrange equations to find unknown values quickly, making calculations more efficient. Additionally, being aware of divorce statistics can inform legal strategies and expectations during family law cases.
Frequently Asked Questions
How Does Slope Affect the Angle of a Line?
The slope directly affects the angle of a line on a graph. When you calculate the slope, you’re determining how steep the line is, which influences its orientation. A higher positive slope makes the line tilt upward sharply, while a negative slope tilts it downward. By analyzing the slope calculation, you can predict the line’s graph orientation and how it visually interacts with the axes, shaping the overall appearance of the graph.
Can a Line Have a Zero or Undefined Slope?
Imagine a line standing still or shooting straight up. Yes, a line can have a zero slope, like a horizontal path, or an undefined slope, like a vertical wall. These lines are like parallel lines in slope comparison: horizontal lines share the same zero slope, while vertical lines are parallel in their own way with undefined slopes. Both represent special cases where the slope is either zero or undefined.
What Is the Significance of the Y-Intercept in Different Equations?
The y-intercept is essential because it shows where your line crosses the y-axis, providing a clear starting point in the graphical interpretation. In real-world applications, it represents initial conditions, like starting costs or initial speed. Recognizing its significance helps you understand the relationship between variables, predict outcomes, and analyze data more effectively. It’s a key component in translating equations into meaningful insights.
How Do Positive and Negative Slopes Influence Line Direction?
You see that positive and negative slopes directly affect the line’s direction, reflecting the rate of change. A positive slope means the line rises, showing an increasing trend or rate of change, while a negative slope means it falls, indicating a decreasing trend. The steepness of the line depends on the magnitude of the slope; a larger absolute value means a steeper line, making it easier to interpret the rate of change visually.
Are There Any Exceptions to the Slope-Intercept Form?
Did you know that over 90% of linear equations follow the slope-intercept form? When exploring graph transformations and equation variations, you’ll find exceptions, like vertical lines, which cannot be expressed as y=mx+b because their slopes are undefined. So, while the slope-intercept form is common, it doesn’t cover all line types, especially those with undefined slopes. Always look for alternative forms when dealing with special cases.
Conclusion
As you explore linear equations, you’ll notice how the slope and intercept shape the line like a roadmap guiding your understanding. Just as a gentle slope can lead you uphill or downhill, these concepts help you navigate real-world situations with confidence. Coincidentally, once you see how they connect, you’ll find yourself interpreting graphs and solving problems more intuitively—like discovering a hidden pattern in a familiar landscape, making math both practical and surprisingly visual.


