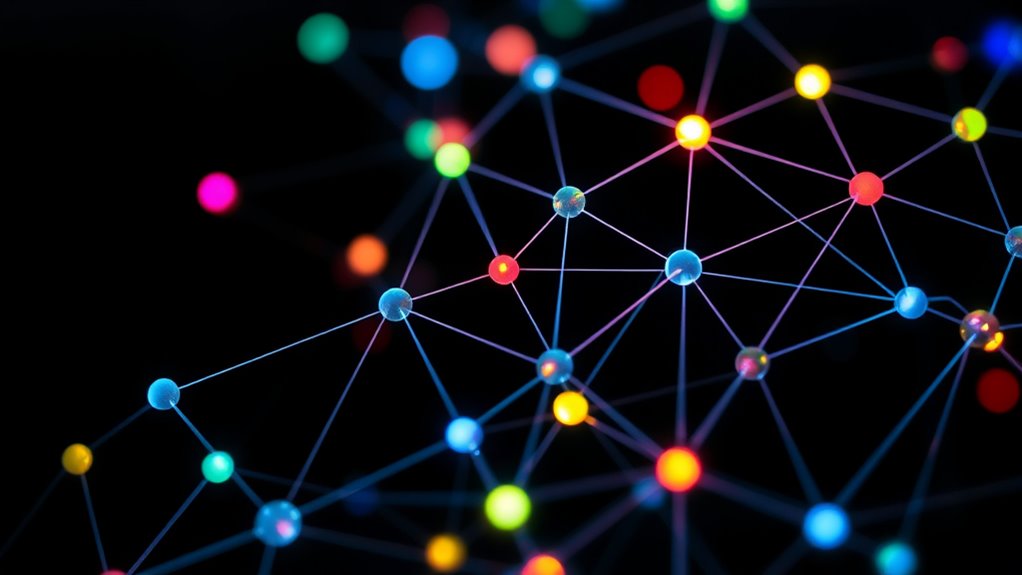
Graph theory helps you understand how networks are built using nodes and edges. Nodes represent entities like people, cities, or devices, while edges show their connections or interactions. By analyzing these components, you can see how information flows and identify key parts of a system. Learning these basics reveals how networks function and evolve—if you keep exploring, you’ll discover even more ways to apply these concepts to real-world problems.
Key Takeaways
- Nodes are entities like people or cities, representing points in a network.
- Edges are connections between nodes, illustrating relationships or interactions.
- Networks are modeled using graphs, combining nodes and edges to visualize complex systems.
- Graph theory studies properties like connectivity, paths, and cycles within these structures.
- Understanding nodes and edges helps analyze and optimize network flow and resource allocation.

Have you ever wondered how networks like social media, transportation systems, or communication grids are organized? At the core of understanding these complex structures lies graph theory, a branch of mathematics that models relationships using nodes and edges. Think of nodes as the points or entities in a network—people, cities, devices—and edges as the connections or interactions between them. This simple concept helps break down intricate systems into manageable, visual representations. When you examine a social network, for example, each user becomes a node, and their friendships or interactions form the edges. Recognizing these components allows you to analyze how information spreads, identify influential nodes, or optimize routes.
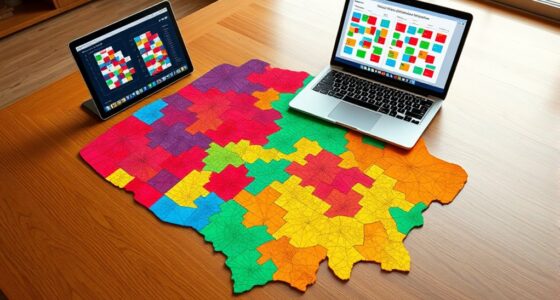
One fundamental idea in graph theory is edge coloring, which involves assigning colors to edges so that no two edges sharing a common node have the same color. This technique is useful in scheduling problems, like assigning frequencies to cell towers or designing traffic light patterns to reduce congestion. By understanding how to properly color edges, you can prevent conflicts and guarantee efficient operation within the network. Edge coloring also plays a role in problems related to graph isomorphism—determining whether two graphs are structurally identical, even if they look different. When two graphs are isomorphic, their nodes can be mapped onto each other in a way that preserves the connections, meaning they are fundamentally the same network with different labels or layouts. Recognizing graph isomorphism is vital in pattern recognition, database retrieval, and verifying network equivalences. It allows you to understand whether different representations are truly the same or if they have unique structures.
Understanding these concepts helps you see how different networks can be analyzed and optimized. For example, in transportation planning, recognizing graph isomorphism can reveal similar traffic patterns across cities, enabling you to apply successful strategies universally. Edge coloring can help schedule maintenance or manage bandwidth in communication networks, guaranteeing minimal interference. When exploring network resilience or vulnerability, these ideas assist in identifying critical nodes or edges, so you know where to reinforce or monitor. Additionally, advanced algorithms in graph theory facilitate efficient network analysis, allowing for faster and more accurate insights into complex systems. By grasping how nodes and edges function within a network, and how techniques like edge coloring and graph isomorphism are used, you gain tools to decode, improve, and innovate within complex systems. Whether you’re managing transportation, optimizing communication channels, or analyzing social connections, these foundational principles empower you to understand and shape the networks that connect our world.
Frequently Asked Questions
How Does Graph Theory Apply to Social Network Analysis?
You can apply graph theory to social network analysis by identifying communities and understanding influence propagation. By analyzing how nodes (people) connect through edges, you spot clusters or communities, revealing social groups. Additionally, you track how influence spreads across the network, helping you predict trends or behaviors. This approach enables you to map relationships, optimize communication, and enhance strategies for engagement or marketing within social platforms.
What Are Some Real-World Examples of Graph Algorithms?
You can see graph algorithms in action in transportation networks, helping optimize routes and reduce congestion, or in biological pathways, mapping interactions within cells. Algorithms like Dijkstra’s find shortest paths, while others identify influential nodes. These tools help you analyze complex systems efficiently, making decisions easier. Whether for logistics or understanding biological processes, graph algorithms provide essential insights into the interconnected nature of real-world systems.
How Do Weighted Graphs Differ From Unweighted Graphs?
Imagine a world where roads have tolls—welcome to weighted graphs! Here, each edge has a weight representing connection strength or cost, making your route decisions more nuanced. Unweighted graphs, by contrast, treat all connections equally—like free highways with no tolls. So, in weighted graphs, you get a detailed map that guides you based on edge weights, helping you find the quickest, cheapest, or most efficient path.
Can Graph Theory Be Used in Machine Learning Models?
Yes, you can definitely use graph theory in machine learning models. You’ll find graph neural networks particularly useful for tasks like feature extraction, where they analyze the structure of data represented as graphs. By leveraging relationships between nodes and edges, these models capture complex patterns, enabling more accurate predictions and insights in areas like social networks, recommendation systems, and biological data.
What Are Common Challenges in Large-Scale Network Visualization?
You face a visualization challenge that’s practically an enormous mountain! Large-scale network visualization often struggles with scalability issues, making it hard to handle millions of nodes and edges. The visualization complexity skyrockets, leading to cluttered, unreadable graphs. You need efficient algorithms and tools to simplify and organize data, but even then, maintaining clarity and insight remains tough. Balancing detail and readability is the key to overcoming these obstacles.
Conclusion
Now that you understand nodes, edges, and networks, you’re practically a graph theory superhero! With this knowledge, you can navigate complex systems faster than a lightning bolt, solving problems that might stump even the brightest minds. Remember, these basics are your secret toolkit—use them wisely, and you’ll conquer challenges that once seemed impossible. You’re not just learning about graphs; you’re uncovering the power to transform the way you see and solve the world’s most tangled problems!


