To plot points and graph lines in coordinate geometry, start by locating the x-coordinate on the horizontal axis, then move horizontally. Next, find the y-coordinate vertically and mark the point where both movements intersect. For lines, use the slope-intercept form to plot and connect points accurately, employing grid paper and rulers. Mastering these steps helps you visualize equations clearly, and there’s more to discover if you keep exploring this essential skill.
Key Takeaways
- Find the x-coordinate on the horizontal axis and move horizontally, then move vertically to the y-coordinate to plot a point.
- Use the slope-intercept form y = mx + b to plot and graph lines accurately.
- Plot two precise points based on the linear equation and connect them with a ruler for a straight line.
- For inequalities, draw dashed lines and shade the solution area to represent the inequality correctly.
- Utilize grid paper and coordinate transformations for accurate plotting and to understand geometric relationships.
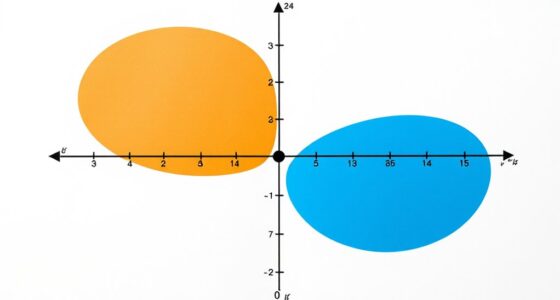
Understanding the Coordinate Plane
The coordinate plane is a two-dimensional surface that helps you locate points precisely using numbers. It’s part of coordinate systems, which organize space into axes—usually labeled x and y—allowing you to identify any point with an ordered pair. Understanding the coordinate plane also involves coordinate transformations, which change a point’s position by shifting, rotating, or scaling it, without losing its original relationship. These transformations are useful when you need to analyze figures or graphs from different perspectives. Recognizing how the coordinate plane works provides a foundation for plotting points accurately and understanding geometric relationships. By mastering coordinate systems and transformations, you’ll gain a clearer, more flexible way to interpret and manipulate graphical data.
How to Plot Points on the Graph
Are you ready to learn how to accurately plot points on a graph? To master coordinate plotting, follow these steps:
- Find the x-coordinate on the horizontal axis.
- Move horizontally to the right (or left if negative) to reach the x-value.
- From there, move vertically to the y-coordinate on the vertical axis.
- Place a dot where these two movements intersect.
Understanding the importance of contrast ratio can help you better interpret detailed images and improve your plotting accuracy. Visualize each step clearly—locate the x-value first, then the y-value—so your point is perfectly plotted. Remember, plotting points involves understanding the coordinate plane and carefully following the ordered pair. Practice these steps to become confident in coordinate plotting, ensuring your points are accurate and your graphing precise.
Graphing Linear Equations

Graphing linear equations allows you to visualize relationships between variables quickly and effectively. To do this, use the slope-intercept form, written as y = mx + b, where m is the slope and b is the y-intercept. Start by plotting the y-intercept on the graph. Then, use the slope to find another point: rise over run. Connect these points with a straight line. When graphing inequalities, such as y > 2x + 3, you’ll draw a dashed line to show the boundary and shade the area that satisfies the inequality. This visual approach helps you understand how variables relate and interact. Additionally, understanding the key elements of farmhouse charm, such as vintage furniture and natural materials, can enrich your appreciation of rustic decor. Mastering these techniques makes analyzing and interpreting linear relationships more straightforward and intuitive.
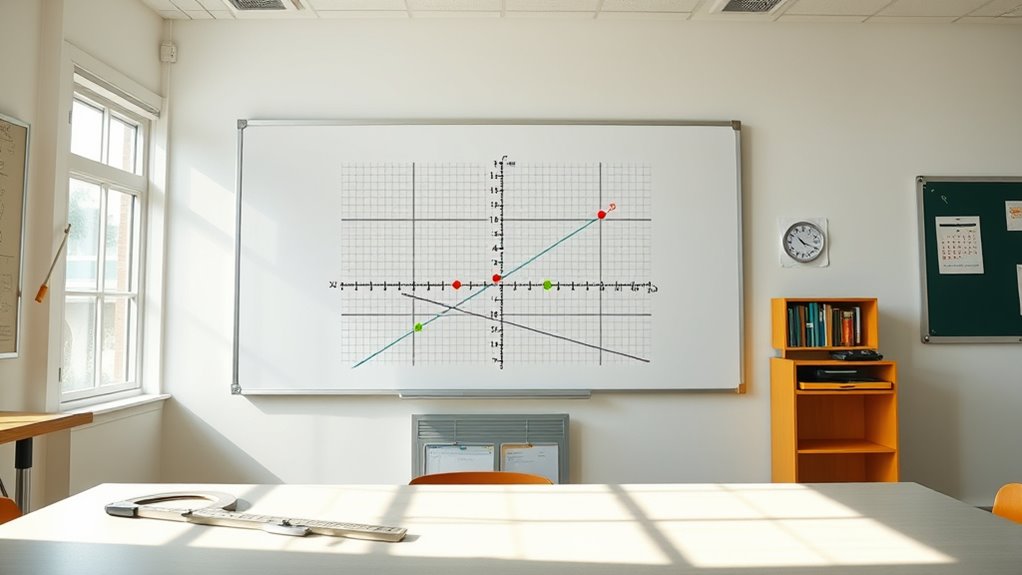
Tips for Accurate Line Drawing

To draw a line accurately, start by plotting two precise points based on the equation. Use grid paper to help keep your points aligned and avoid errors. When plotting, focus on these steps:
- Calculate the slope through slope calculation to determine the line’s steepness.
- Choose a clear point on the grid, then find the second point by applying the slope.
- Mark both points carefully, ensuring they’re on the correct grid intersections.
- Use a ruler to connect the points with a straight line, maintaining accuracy.
This method guarantees your line reflects the correct slope and position. Remember, precision in plotting and connecting points on grid paper minimizes mistakes and produces a clean, accurate graph.
Applying Coordinate Geometry to Real-World Problems

Coordinate geometry provides practical tools for solving real-world problems by translating physical situations into mathematical models. For example, you can determine the distance between two points using the distance formula, which helps in navigation, planning, or optimizing routes. Circle equations are useful for modeling objects with circular boundaries, like playgrounds or water tanks. By applying these formulas, you can find if a point lies within a circle or calculate the size of a circular area. These concepts are also essential in fields like engineering, architecture, and urban planning. By understanding how to manipulate circle equations and use the distance formula, you can analyze spatial relationships, improve accuracy, and make data-driven decisions in everyday scenarios. Additionally, space utilization techniques like plotting points and lines can help optimize the layout of a space for better functionality and efficiency.
Frequently Asked Questions
How Do I Find the Distance Between Two Points?
To find the distance between two points, you use the distance formula on the coordinate plane. First, identify the coordinates of each point, then subtract the x-values and square the result, doing the same for the y-values. Add these squares together, and take the square root of that sum. This process helps you measure the straight-line distance accurately between any two points on the coordinate plane.
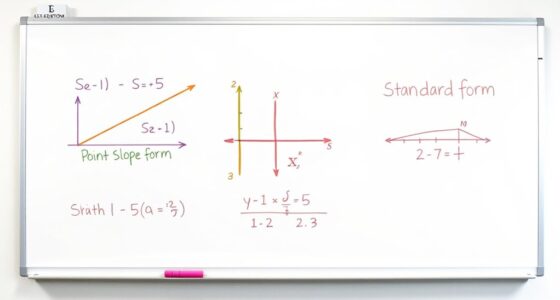
What Is the Slope-Intercept Form of a Line?
The slope-intercept form of a line helps you quickly understand its graphing equations and line intercepts. It’s written as y = mx + b, where m is the slope, showing how steep the line is, and b is the y-intercept, where the line crosses the y-axis. You can easily graph the line by plotting the intercept and using the slope to find other points, making your graphing process straightforward.
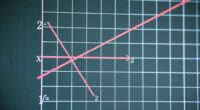
How Can I Determine if Lines Are Parallel or Perpendicular?
To determine if lines are parallel or perpendicular, you compare their slopes. If the slopes are equal, the lines are parallel. For perpendicular lines, use the perpendicularity criteria: their slopes are negative reciprocals (multiply to -1). For example, if one slope is 2, the other should be -1/2. This slope comparison helps you identify the relationship between lines quickly and accurately.
What Are Common Mistakes When Plotting Points?
Did you know that 40% of students struggle with accurate plotting? When plotting points, you often mislabel coordinates or neglect scale, causing errors. A common mistake is mixing up the x and y values, which skews your graph. Always double-check your coordinates and confirm the scale is consistent. Taking your time and verifying each point helps you avoid these pitfalls and creates precise, reliable graphs.
How Do I Convert From Standard Form to Slope-Intercept Form?
When converting equations from standard form to slope-intercept form, you focus on isolating y. Start by rewriting the standard form, Ax + By = C, then solve for y by subtracting Ax from both sides. Next, divide everything by B to get y alone. This process helps you understand the slope and y-intercept clearly, making it easier to graph the line and analyze its behavior.
Conclusion
Now, imagine yourself confidently charting points on a crisp graph paper, each coordinate marking a stepping stone across a vibrant grid. As you connect these dots, lines emerge like pathways guiding you through a landscape of possibilities. With practice, you’ll navigate the coordinate plane effortlessly, turning abstract numbers into clear, visual stories. Feel the satisfaction of drawing precise lines and solving real-world problems, transforming math into a vivid, engaging journey.