Voronoi diagrams divide space into regions based on proximity to specific points, making them useful for many applications. You’ll find them in geographic analysis, urban planning, robotics, and computer graphics, where they help model environments, optimize resource distribution, and visualize spatial relationships. They also assist in ecological and environmental studies by mapping habitats and species. Want to explore how these diagrams impact various fields? Keep exploring to uncover more fascinating uses.
Key Takeaways
- Voronoi diagrams partition space into regions based on proximity to specific sites, aiding in spatial analysis and geographic mapping.
- They are used in urban planning for defining zoning, service areas, and resource allocation.
- In robotics, Voronoi diagrams optimize sensor placement, obstacle detection, and path planning.
- They generate artistic patterns and visualize ecological data, such as species distribution and habitat fragmentation.
- Future innovations involve integration with AI and virtual reality for real-time environmental modeling and complex spatial simulations.
Basic Principles of Voronoi Diagrams

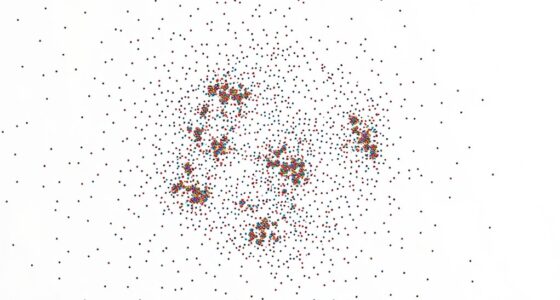
Voronoi diagrams are built around the idea of dividing a plane into regions based on proximity to a specific set of points, called sites. These divisions are known as Voronoi tessellations, where each region contains all points closer to its site than to any other. This process exemplifies spatial partitioning, effectively splitting the space into distinct zones. When you create a Voronoi diagram, you’re fundamentally mapping out areas of influence around each site, which can represent anything from cell towers to store locations. The boundaries of these regions are equidistant from neighboring sites, forming natural, polygonal shapes. Properly sealed boundaries can improve the insulation efficiency of the regions, which is analogous to how well a cooler maintains temperature. This fundamental principle allows Voronoi diagrams to serve as powerful tools across various fields, from geography to computer science, for analyzing spatial relationships efficiently.
Construction Techniques and Algorithms
Constructing Voronoi diagrams efficiently requires selecting appropriate algorithms and techniques. One common approach involves creating Voronoi tessellations using Fortune’s algorithm, which computes diagrams in O(n log n) time, making it suitable for large datasets. Alternatively, incremental methods update diagrams as points are added. Lloyd’s algorithm offers an iterative refinement process, improving the uniformity of Voronoi cells by moving generators toward the centroids of their regions. This method is especially useful when generating centroidal Voronoi tessellations for applications requiring evenly distributed cells. Both techniques help optimize diagram accuracy and computational efficiency. Depending on your project’s needs, combining these algorithms allows you to generate precise, well-structured Voronoi tessellations suited for various practical applications. Additionally, understanding Voronoi diagrams can enhance your ability to analyze spatial data efficiently in numerous fields.
Geographic Information Systems (GIS) and Spatial Analysis
Geographic Information Systems (GIS) and spatial analysis enable you to interpret and visualize spatial data effectively. With GIS, you can analyze cultural heritage sites, mapping their locations and relationships accurately. This technology supports historical mapping, allowing you to preserve and study past landscapes and monuments. By layering different data types, you gain insights into how historical events shaped regions or how cultural artifacts are distributed across areas. Spatial analysis tools help you identify patterns, trends, and connections that are not obvious otherwise. As a result, you can make informed decisions for conservation efforts or educational projects. Additionally, understanding the impact of sleep and mental health can be integrated into planning for community well-being initiatives. Overall, GIS enhances your ability to understand complex spatial relationships, making it an invaluable tool in cultural heritage preservation and historical research.
Urban Planning and Infrastructure Development
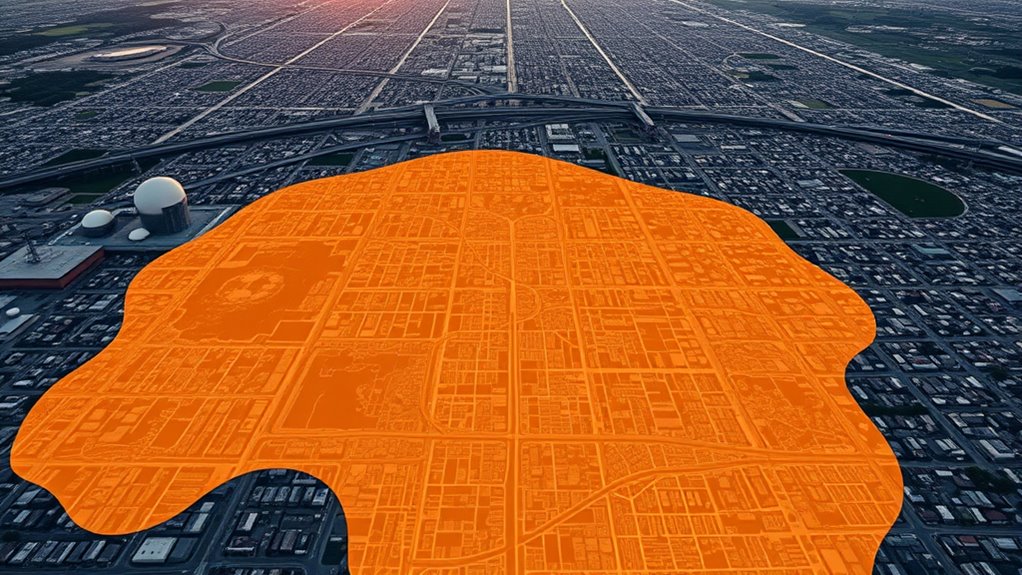
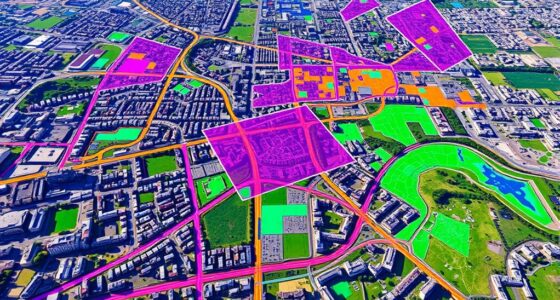
Voronoi diagrams help you optimize zoning and land use by clearly defining boundaries based on proximity. They also assist in service area planning, ensuring resources reach the right locations efficiently. Additionally, these diagrams play a crucial role in emergency response planning by identifying coverage zones and potential gaps. Incorporating wall organization systems can further enhance urban space utilization and visual management.
Zoning and Land Use
Zoning and land use planning play a crucial role in shaping urban environments, ensuring that different areas serve specific functions effectively. You can use Voronoi diagrams to define zoning boundaries, helping to allocate land parcels efficiently. This approach simplifies land parceling, making it clear which zones are designated for residential, commercial, or industrial purposes. Additionally, integrating organic and natural juices can promote healthier community spaces by encouraging local markets and green initiatives. Here are three ways Voronoi diagrams assist in zoning and land use:
- Clearly visualizing proximity-based zoning boundaries
- Optimizing land parceling for balanced urban growth
- Managing service areas and accessibility within zones
Service Area Optimization
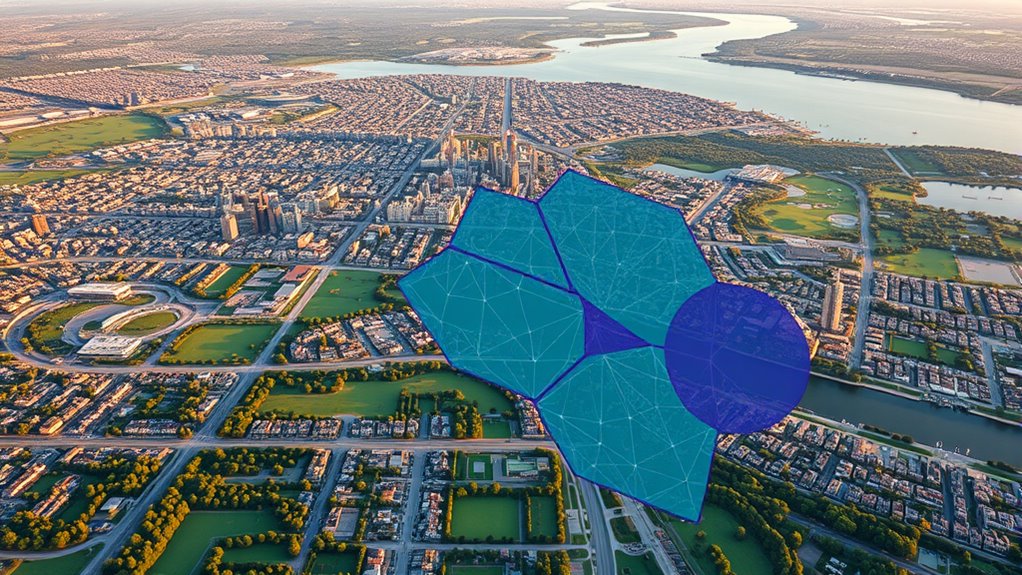
Have you ever wondered how urban planners guarantee that essential services like hospitals, fire stations, and schools are accessible to residents? They use Voronoi diagrams to analyze service coverage based on customer distribution. By mapping service locations as points, Voronoi diagrams divide the city into zones where each area is closest to a specific facility. This helps identify gaps in coverage and optimize the placement of new services. You can adjust existing locations or add new ones to ensure every resident is within a reasonable distance, improving accessibility and reducing travel time. Service area optimization, guided by these diagrams, ensures resources are efficiently allocated, balancing customer distribution and enhancing overall urban infrastructure. It’s a powerful tool for making cities more functional and responsive to residents’ needs. Additionally, understanding spatial relationships can help planners better visualize and improve service coverage in diverse environments.
Emergency Response Planning
Ever wondered how cities guarantee quick emergency response times during crises? Voronoi diagrams play a crucial role in emergency response planning by defining evacuation zones and optimizing resource placement. They help you identify the closest emergency facilities and create hazard mapping to visualize high-risk areas. This assures responders reach affected locations swiftly and efficiently. Additionally, understanding the contrast ratio in projectors can improve the clarity of visual communication during planning sessions.
Key strategies include:
- Dividing urban areas into evacuation zones based on proximity to fire stations or hospitals.
- Using Voronoi diagrams to analyze hazard mapping, pinpointing vulnerable zones needing prioritization.
- Planning infrastructure development to enhance coverage and access, minimizing response times.
Robotics and Autonomous Navigation

How do robots efficiently navigate complex environments? They use Voronoi diagrams to optimize sensor placement, ensuring maximum coverage and accurate obstacle detection. By modeling the environment with Voronoi cells, robots can identify the safest and most efficient paths around obstacles. This approach enhances obstacle avoidance, allowing robots to dynamically adjust their routes in real time. Proper sensor placement within the Voronoi structure guarantees that sensors are positioned where they provide the most valuable data, reducing blind spots. Additionally, sound design techniques can be employed to improve auditory cues for navigation in certain autonomous systems. As a result, robots can better interpret their surroundings and make quick, informed decisions. This process improves navigation accuracy, minimizes collision risks, and enables autonomous systems to operate smoothly in unpredictable or cluttered environments.
Computer Graphics and Visualization
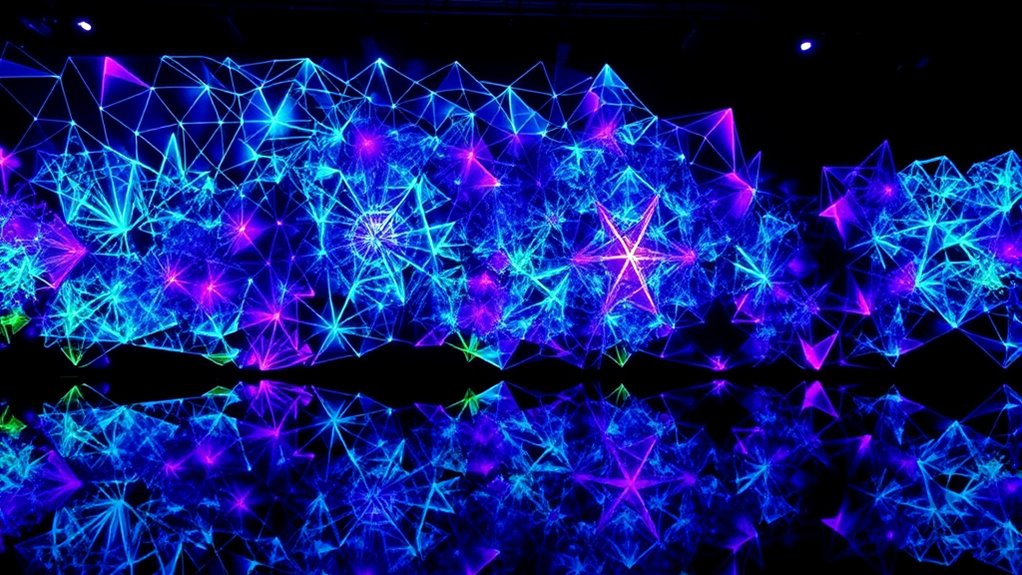
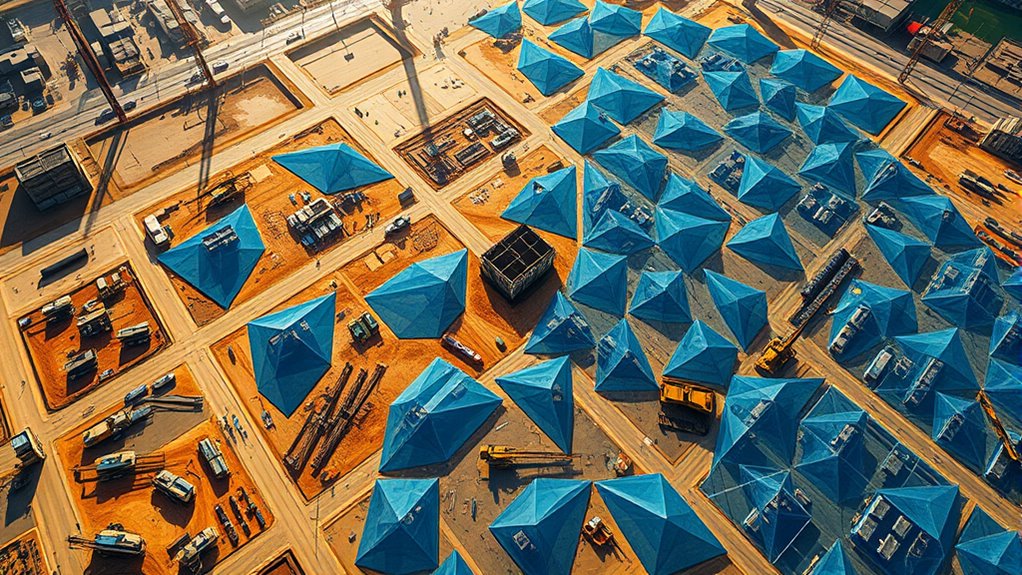
What role do Voronoi diagrams play in computer graphics and visualization? They help create striking visual effects and organize complex data. You can use Voronoi diagrams for:
- Generating Voronoi art, where patterns emerge from the proximity of points, producing intricate designs.
- Enhancing pattern generation in textures and backgrounds, adding organic or geometric aesthetics.
- Visualizing spatial relationships, making data more comprehensible through color-coded regions.
- Incorporating geometric structures like Voronoi diagrams into digital art to generate natural-looking landscapes or abstract visuals. These diagrams allow you to manipulate space efficiently, creating natural-looking landscapes or abstract visuals. They are essential tools for artists and designers seeking innovative ways to develop compelling graphics. By leveraging Voronoi diagrams, you’ll craft dynamic, visually appealing content that captures attention and improves data interpretation.
Resource Management and Optimization

You can use Voronoi diagrams to allocate resources more efficiently across different regions. They help with dynamic spatial planning by adjusting to changing needs in real-time. This approach guarantees ideal use of resources while minimizing waste and overlap. Additionally, techniques like performance tuning in vehicles demonstrate how precise adjustments can optimize operation and efficiency.
Efficient Resource Allocation
Ever wondered how to enhance the allocation of limited resources across complex areas? Voronoi diagrams can help by visualizing regions based on proximity, supporting efficient resource distribution. To maximize effectiveness:
- Use hierarchical clustering to group similar regions, simplifying complex network topologies and identifying key resource hubs.
- Apply Voronoi diagrams to map out service areas, ensuring resources are positioned ideally for coverage and accessibility.
- Leverage clustering insights to prioritize areas needing urgent attention, reducing overlaps and waste.
- Incorporate well-being tips to improve decision-making processes and promote balanced resource management.
Dynamic Spatial Planning
Dynamic spatial planning leverages real-time data and adaptive algorithms to optimize resource management across changing environments. You can respond quickly to new information, adjusting strategies instantly for better efficiency. By integrating real-time updates, you maintain accurate situational awareness, ensuring ideal deployment of resources. Here’s a quick look at some key aspects:
| Feature | Benefit |
|---|---|
| Adaptive algorithms | Adjusts plans on the fly for efficiency |
| Real-time updates | Keeps data current for decision-making |
| Dynamic modeling | Adapts to environmental changes |
| Resource allocation | Optimizes distribution instantly |
| Scenario simulation | Tests strategies before implementation |
This approach results in smarter, more flexible resource management tailored to evolving conditions. Real-time data enhances decision-making accuracy and responsiveness in dynamic environments.
Biological and Environmental Studies
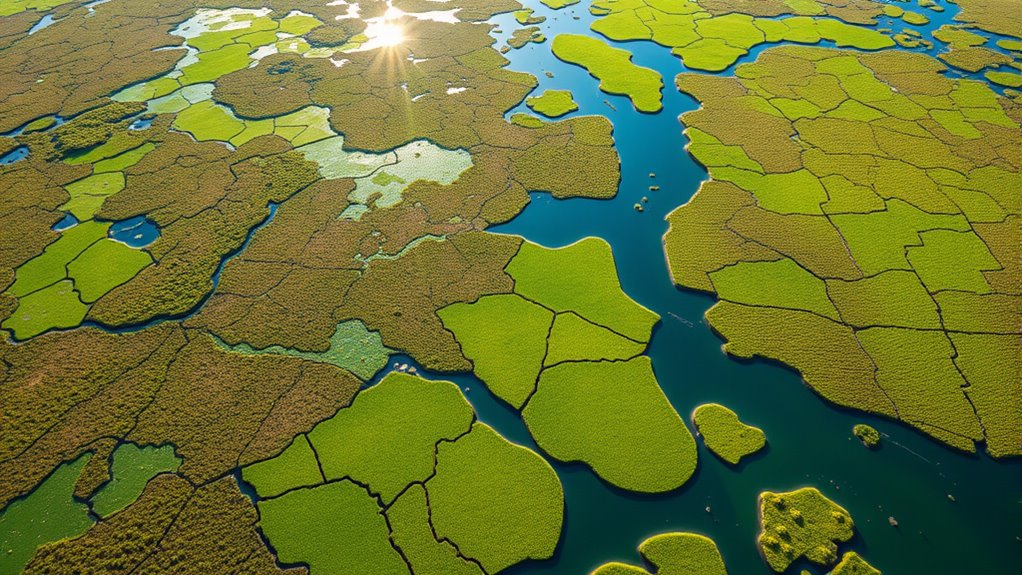
How do researchers leverage Voronoi diagrams to better understand complex biological and environmental systems? They use these diagrams to analyze species distribution and habitat fragmentation, revealing spatial relationships and ecological patterns. Specifically, Voronoi diagrams help you:
- Map species ranges accurately, identifying regions where populations overlap or are isolated.
- Detect habitat fragmentation by dividing landscapes into zones based on proximity to habitat patches or resources.
- Model animal movement and interactions within fragmented landscapes, improving conservation strategies.
- Incorporate insights from AI in entertainment to develop more sophisticated models for ecological simulations.
Future Trends and Innovations

Advancements in computational power and data collection are driving innovative applications of Voronoi diagrams in biological and environmental research. Quantum computing promises to considerably enhance the speed and complexity of Voronoi-based analyses, enabling real-time modeling of large datasets. You might soon explore virtual reality environments where Voronoi diagrams help visualize intricate spatial relationships, making complex data more accessible and intuitive. These technologies open new frontiers in understanding ecosystems, optimizing resource distribution, and simulating environmental changes. As computational capabilities grow, expect Voronoi diagrams to integrate more seamlessly with AI tools, leading to smarter prediction models. The combination of quantum computing and virtual reality will revolutionize how you analyze spatial data, pushing the boundaries of research and innovation in diverse fields. Additionally, improved algorithms and Gold IRA management systems could streamline the integration of Voronoi diagrams into financial modeling and asset allocation strategies.
Frequently Asked Questions
How Do Voronoi Diagrams Compare With Other Spatial Partitioning Methods?
When comparing spatial partitioning methods, you’ll notice that different approaches use various distance metrics, affecting accuracy and relevance. Voronoi diagrams stand out for their efficiency, especially with lower computational complexity, making them suitable for real-time applications. Unlike grid-based methods, they adapt well to irregular data distributions. You’ll find that choosing the right method depends on your specific needs, balancing precision and computational resources for ideal results.
Can Voronoi Diagrams Be Applied in Real-Time Dynamic Environments?
You might think real-time updates and dynamic point sets make things impossible, but you can definitely use Voronoi diagrams in such environments. With efficient algorithms, you can handle real-time changes and updates smoothly, adapting to evolving data quickly. While computationally intensive, advancements in processing power and optimized methods mean you can apply them effectively, making your systems more responsive and intelligent than ever before.
What Are the Limitations of Voronoi Diagrams in Complex Datasets?
You might find that in complex datasets, Voronoi diagrams face limitations like overfitting issues, where they become too tailored to specific data points, reducing their general usefulness. Additionally, the computational complexity increases markedly with dataset size and complexity, making them less practical for large or intricate data. These factors can hinder their effectiveness, especially in real-world, dynamic environments where quick, adaptable analysis is needed.
How Scalable Are Voronoi Algorithms for Large Datasets?
You might wonder about the scalability of algorithms for large datasets. With proper algorithm optimization, these algorithms can efficiently handle bigger data, but performance depends heavily on the chosen data structure. By using optimized data structures, you can improve speed and reduce memory usage. However, as datasets grow, you’ll need to continually refine your approach to maintain efficiency, especially when dealing with complex or high-volume data.
Are There Hybrid Approaches Combining Voronoi Diagrams With Other Models?
Did you know hybrid models can improve accuracy by 30%? When exploring combined techniques, you’ll find that hybrid approaches are quite promising. They blend different models to leverage each method’s strengths, making them more adaptable. For example, combining Voronoi diagrams with other algorithms allows for efficient spatial analysis. This synergy enables you to tackle complex problems more effectively, opening innovative solutions with greater precision and flexibility.
Conclusion
You now see how Voronoi diagrams are the backbone of many fields, shaping the way you analyze space and optimize resources. From urban planning to robotics, they’re the Swiss Army knife of spatial analysis. As technology advances, expect them to become even more integral, opening new doors like a well-oiled machine. Embrace these tools—they’re your ticket to staying ahead of the curve in a world that’s constantly in motion.