
To explore conic sections in GeoGebra, start by drawing the basic conics such as ellipses, hyperbolas, and parabolas. Add their key elements, like foci and directrices, and experiment by dragging these points to see how the shapes change. Adjust eccentricity and observe how the properties evolve in real time. Continue exploring these interactions to deepen your understanding of conic behaviors and relationships beyond the basics.
Key Takeaways
- Use GeoGebra’s conic tools to draw and visualize ellipses, hyperbolas, and parabolas dynamically.
- Add and move foci and directrices to observe their influence on conic shapes in real time.
- Adjust parameters like eccentricity to see how conic properties and shapes change interactively.
- Use the measurement tools to explore distances and verify conic definitions related to foci and directrices.
- Experiment with dragging points and sliders to deepen understanding of conic sections’ geometric relationships.
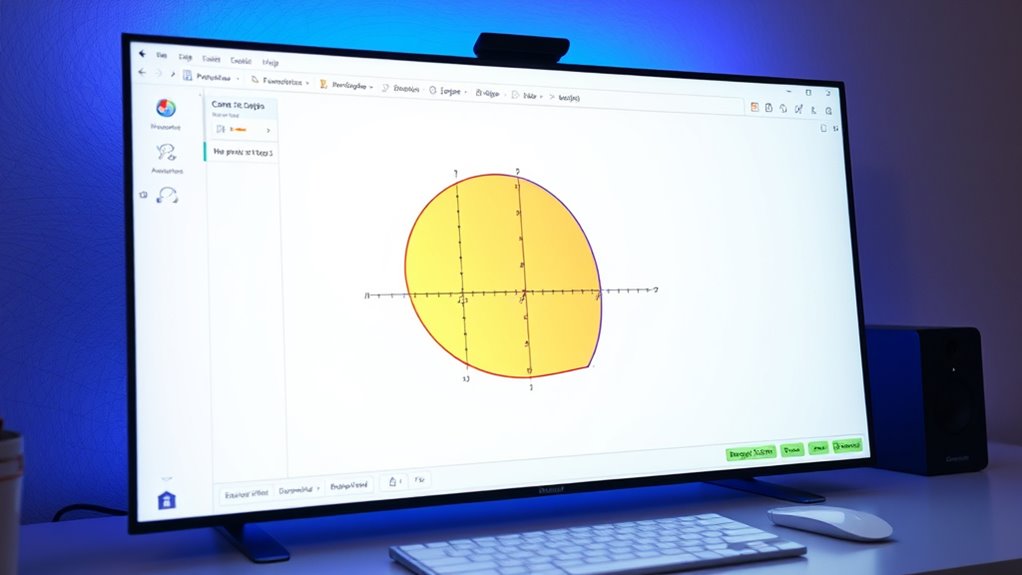
Conic sections—circles, ellipses, parabolas, and hyperbolas—are fundamental topics in geometry that often challenge students to visualize their properties. When exploring these shapes, understanding key elements like foci, directrices, eccentricity, and shape becomes essential. GeoGebra provides a powerful platform to make these concepts tangible by allowing you to manipulate and observe conic sections dynamically. You can start by drawing a conic and then adding its foci and directrices. For example, in an ellipse, you’ll notice the foci are points inside the shape, and the sum of the distances from any point on the ellipse to these foci remains constant. By dragging the foci around, you see how the shape changes, but the sum stays the same. This immediate visual feedback helps you grasp how foci influence the ellipse’s shape and size.
Explore conic sections interactively with GeoGebra—see how foci shape ellipses, hyperbolas, and parabolas through dynamic manipulation.
Similarly, for hyperbolas, you can set foci and observe how the difference in distances from any point on the hyperbola to these foci remains constant. GeoGebra allows you to adjust the positions of the foci and see how the hyperbola’s branches respond in real time. This interactive approach clarifies how the foci determine the hyperbola’s structure and how the distances shape the curve. When working with parabolas, you can set a focus and a directrix, then watch the parabola form as you move the focus or change the directrix’s position. This helps you understand that a parabola is the locus of points equidistant from the focus and the directrix, emphasizing the role both elements play in defining its shape.
Eccentricity is a vital measure that quantifies how “stretched” or “circular” a conic is. In GeoGebra, you can easily calculate and visualize eccentricity by adjusting parameters, observing how it affects the shape’s appearance. For circles, the eccentricity is zero, indicating perfect symmetry. As you increase eccentricity for ellipses, the shape elongates, reflecting a more pronounced difference between the lengths of the axes. Hyperbolas have eccentricities greater than one, making them appear more open and stretched out. By exploring these variations interactively, you gain a deeper understanding of how eccentricity influences the conic’s overall shape.
Using GeoGebra to explore conic sections allows you to experiment freely, see the immediate effects of changing key properties, and develop intuition about their geometric relationships. This hands-on approach makes abstract concepts more concrete, helping you visualize how foci, directrices, eccentricity, and shape are interconnected in defining each conic.
Frequently Asked Questions
Can Geogebra Animate Conic Sections Dynamically?
You can definitely animate conic sections dynamically in GeoGebra. The software offers interactive features that allow you to create dynamic visualizations, making it easy to see how conic sections change with different parameters. By adjusting sliders or using the animation toolbar, you can animate transformations and explore various properties visually. This dynamic visualization enhances your understanding and makes studying conic sections more engaging and intuitive.
Is It Possible to Customize Conic Section Parameters in Geogebra?
Oh, the thrill of customizing conic sections in GeoGebra—who wouldn’t want to tweak those parameters endlessly? Yes, you can! You simply adjust the sliders or input specific values to set custom conic parameters. This parameter adjustment lets you explore different ellipses, hyperbolas, and parabolas to your heart’s content. So go ahead, personalize your conics and watch your mathematical masterpiece come to life!
How Do I Save and Share My Geogebra Conic Explorations?
You can easily save your GeoGebra conic explorations by clicking the save icon or selecting File > Save, which stores your work online or locally. To share your findings, generate a sharing link by clicking the share button, then copy and send it to others. This way, you guarantee your conic explorations are accessible and easily shared with classmates or teachers for collaborative learning.
Can Geogebra Analyze Real-World Data to Generate Conic Sections?
Think of GeoGebra as a detective solving mysteries in real-world data. You can input real-world data to visualize and analyze conic sections, making complex concepts easier to grasp. By importing data sets, GeoGebra helps you see how the data fits into conic shapes like ellipses or hyperbolas. This powerful tool turns raw data into clear, visual stories, enhancing your understanding of geometry and data visualization.
Are There Advanced Tools for 3D Conic Sections in Geogebra?
You might wonder if GeoGebra offers advanced tools for 3D conic sections. While GeoGebra primarily focuses on 2D graphing, it does provide 3D visualization features that allow you to explore conic sections in three dimensions. These tools support advanced modeling, helping you better understand the spatial properties of conics. However, for more complex 3D conics, you may need specialized software, but GeoGebra’s 3D tools are quite useful for most educational purposes.
Conclusion
By now, you’ve uncovered the secrets of conic sections with GeoGebra, turning complex curves into your playground. Think of this tool as a key that unlocks hidden patterns, making math feel like a dance rather than a chore. Keep experimenting and let your curiosity be the compass. With GeoGebra as your guide, you’ll find that exploring conic sections is as natural as breathing, transforming abstract concepts into vivid, visual stories.