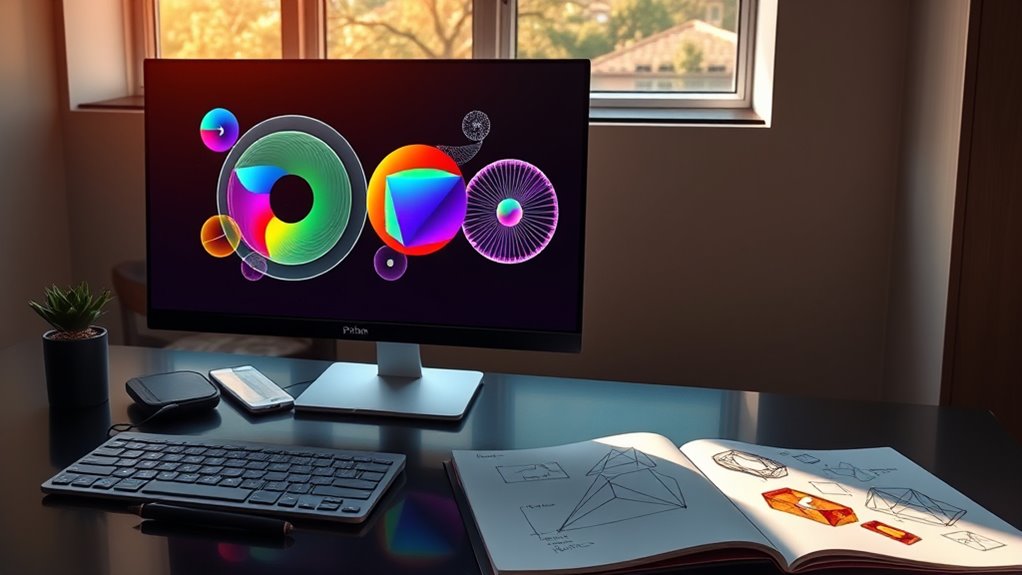
To start with Python for geometric plotting, you can use libraries like Matplotlib, which allows you to create shapes, lines, and polygons easily. With functions for drawing and transforming shapes through rotations, translations, and scaling, you gain precise control over your visualizations. Plotly and Bokeh add options for interactive plots. As you explore these tools further, you’ll discover powerful techniques for crafting accurate and complex geometric visuals—more details await as you continue your journey.
Key Takeaways
- Python libraries like Matplotlib, Plotly, and Bokeh facilitate creating detailed geometric plots.
- Learn to generate vertices in polar coordinates and convert them to Cartesian for regular shapes.
- Use coordinate transformations such as rotation, translation, and scaling to manipulate shapes accurately.
- Master plotting primitives like polygons, circles, and rectangles with customizable styles and labels.
- Combining these techniques enables beginners to produce precise, complex geometric visualizations in Python.

Have you ever wondered how to create precise and visually appealing geometric plots with Python? If so, you’re in the right place. Python offers powerful tools for geometric plotting, and understanding how to leverage them can elevate your data visualization skills. One of the first steps is to familiarize yourself with the concept of coordinate transformations. These are techniques used to convert data points from one coordinate system to another, which is essential when working with complex shapes or when aligning multiple plots. For example, rotating, scaling, or translating shapes requires a solid grasp of coordinate transformations, enabling you to manipulate geometries with accuracy and ease.
To bring your geometric ideas to life, you’ll want to explore various plotting libraries. Matplotlib is the most popular and versatile, offering extensive customization options for plotting points, lines, and shapes. Its `patches` module allows you to add geometric primitives like circles, rectangles, and polygons directly onto your plots. If you’re looking for more interactive or aesthetically modern visualizations, libraries like Plotly and Bokeh are excellent choices. They support dynamic plots that can be zoomed, panned, and styled to highlight specific geometric features.
Getting started with these libraries involves installing them via pip and importing the relevant modules. For example, with Matplotlib, you’ll typically import `pyplot` for basic plotting and `patches` for shapes. Once set up, you can plot simple points or lines and then progressively add complexity by combining shapes, applying coordinate transformations, and customizing colors and labels. Using functions like `transforms` in Matplotlib, you can easily rotate or translate shapes within your plot, which is *essential* for creating accurate geometric representations.
Another key aspect is understanding how to manage coordinate systems within your plots. Whether you’re working with Cartesian coordinates or more advanced systems, knowing how to switch between them helps you plot shapes correctly. For instance, when drawing a regular polygon, you might generate vertices in polar coordinates and then convert them to Cartesian coordinates for plotting. This process exemplifies how coordinate transformations are *vital* to precise geometric plotting.
Frequently Asked Questions
Can Python Handle 3D Geometric Plotting Effectively?
You can definitely handle 3D geometric plotting effectively with Python. It supports creating complex 3D meshes and applying geometric transformations like rotations and scaling. Libraries such as Matplotlib and Plotly make it easy to visualize 3D data interactively. With Python’s capabilities, you can manipulate and render detailed 3D models, making it a powerful tool for geometric plotting, even for beginners exploring 3D visualization techniques.
Which Libraries Are Best for Interactive Geometric Visualizations?
When it comes to interactive geometric visualizations, you want tools that pack a punch and keep things user-friendly. Libraries like Plotly and Bokeh shine here, letting you create interactive dashboards with seamless user interfaces. They make it easy to zoom, hover, and explore 3D or 2D plots dynamically. If you want an intuitive experience, these libraries are your best bet for turning static visuals into engaging, interactive masterpieces.
How to Optimize Plotting Performance for Large Datasets?
To optimize plotting performance for large datasets, you should focus on data compression to reduce memory usage and improve speed. Use efficient rendering techniques like scatter plots with fewer points, aggregation, or level-of-detail methods. Additionally, consider utilizing hardware acceleration where possible. These strategies help your visualizations load faster, stay responsive, and handle big data effectively, ensuring smoother interactions and better overall performance.
Is Python Suitable for Real-Time Geometric Data Visualization?
You can use Python for real-time geometric data visualization, but it depends on your needs for data accuracy and update frequency. Python handles rapid updates well with libraries like Matplotlib, Plotly, or Bokeh, which support interactive and dynamic visualizations. However, for extremely high-frequency updates or highly demanding performance, you might need optimized tools or languages. Overall, Python offers a flexible balance for most real-time visualization tasks.
How to Customize Colors and Styles in Geometric Plots?
You can easily customize colors and styles in your geometric plots by adjusting color schemes and applying style customization options. Use parameters like ‘color’ to change specific element colors, or explore predefined color maps for broader themes. For style customization, tweak line styles, marker types, and widths. Libraries like Matplotlib or Seaborn provide flexible tools, allowing you to create visually appealing plots that match your project’s aesthetic preferences.
Conclusion
Now that you’ve explored Python for geometric plotting, you’re equipped to create complex visualizations with ease. Did you know that Python’s matplotlib library, widely used for plotting, powers over 50% of data visualization tasks worldwide? This shows how versatile and essential Python is for geometric and scientific visualization. Keep experimenting with different shapes and graphs—soon, you’ll turn data into compelling, insightful visuals. Happy plotting!


