
To graph lines effectively, focus on understanding slope and y-intercept. The slope (m) tells you how steep the line is and whether it goes up or down as you move from left to right. The y-intercept (b) shows where the line crosses the y-axis. By plotting the intercept and applying the slope to find additional points, you can draw an accurate line. Keep exploring, and you’ll get better at visualizing these features on a graph.
Key Takeaways
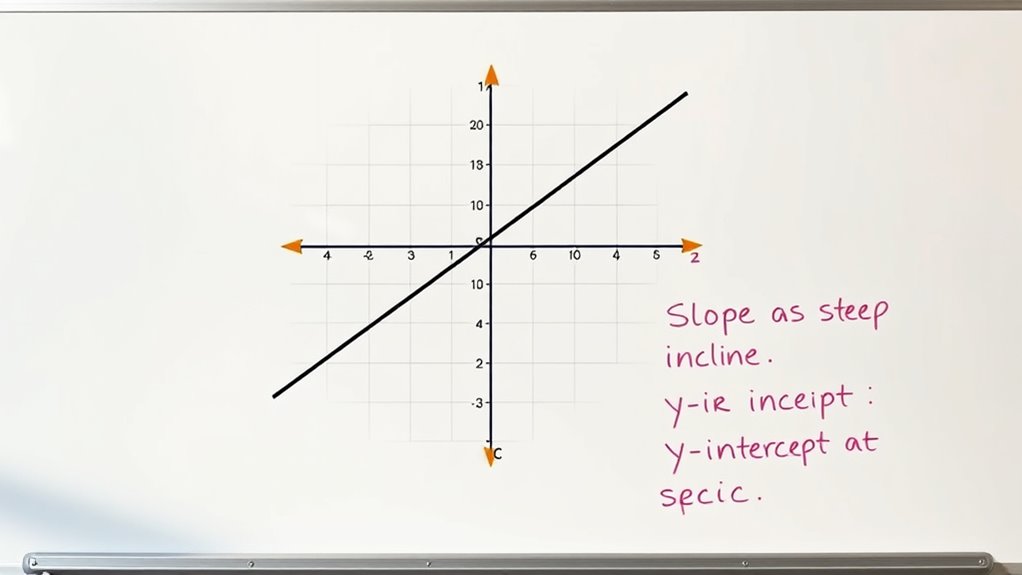
- The slope (m) indicates the line’s steepness and whether it rises or falls as x increases.
- The y-intercept (b) shows where the line crosses the y-axis, providing a starting point for graphing.
- Use the slope as a ratio (rise over run) to find additional points from the y-intercept.
- A positive slope results in an upward trend; a negative slope causes the line to decline from left to right.
- Graphing involves plotting the y-intercept first, then applying the slope to locate other points for drawing the line.
Graphing lines is a fundamental skill in algebra that helps you understand how equations translate into visual representations. When you’re learning to plot linear equations, the slope-intercept form is one of the most straightforward methods to visualize a line quickly. This form, written as y = mx + b, clearly shows the slope (m) and the y-intercept (b), making it easier to plot the line accurately. By mastering how to interpret and use this form, you’ll be able to graph lines efficiently and understand their behavior better.
Once you understand the slope-intercept form, plotting linear equations becomes a simple process. You start by identifying the y-intercept, which is the point where the line crosses the y-axis. This value, b, tells you exactly where to place your first point on the graph. From there, you use the slope, m, to determine how to move from that point. The slope is a ratio of rise over run, which indicates how much y increases or decreases as x changes. For example, if the slope is 2, it means for every 1 unit you move horizontally to the right, you go up 2 units vertically. If the slope is -3, for every 1 unit to the right, you move down 3 units. Plotting linear equations becomes a matter of starting at the y-intercept and then using the slope to find subsequent points.
Plotting linear equations also involves understanding what the slope tells you about the line’s steepness and direction. A larger magnitude slope results in a steeper line, while a smaller slope produces a gentler incline. A positive slope indicates the line rises as you move from left to right, whereas a negative slope means it falls. With this knowledge, you can quickly sketch a line by plotting the y-intercept and then applying the slope to mark additional points. Connecting these points with a straight line completes the graph, giving you a visual understanding of the equation’s relationship. Recognizing the slope’s significance helps you interpret how the line behaves across different contexts.
Practice makes perfect when it comes to plotting linear equations. Start with simple equations in slope-intercept form, identify the y-intercept, and then apply the slope to find other points. This approach helps reinforce your understanding of how the algebraic form relates to the graph. Remember, the more you practice plotting linear equations, the more intuitive it becomes to interpret slopes and intercepts. This skill is essential not only for mastering algebra but also for solving real-world problems where visualizing relationships between variables is vital.
Frequently Asked Questions
How Do I Find the Slope of a Vertical Line?
You can’t find a traditional slope for a vertical line because vertical lines have an undefined slope. Since the slope is calculated as “rise over run,” and the run equals zero for vertical lines, the division can’t happen. So, whenever you see a vertical line, remember its slope is undefined. This is why vertical lines are special and don’t have a numerical slope like other lines do.
Can a Line Have Multiple Slopes?
No, a line can’t have multiple slopes. Each line has a unique slope, which is constant. If two lines are parallel, their slopes are equal, while perpendicular lines have slopes that are negative reciprocals. So, if you see different slopes, you’re looking at different lines. Remember, a single line’s slope stays the same everywhere, whether it’s parallel or perpendicular to other lines.
What Does the Y-Intercept Represent in Real-World Scenarios?
The y-intercept, in real-world scenarios, represents where a line crosses the y-axis in the coordinate plane, showing the starting point or initial amount. For example, if you’re tracking savings, the y-intercept is your initial savings before any deposits. About 85% of data in real-world applications involves understanding intercepts to predict outcomes. It helps you visualize and interpret how variables change over time or across situations effectively.
How Do I Graph Lines With Negative Slopes?
To graph lines with negative slopes, you start with the y-intercept on the y-axis. Use graphing techniques to plot this point accurately. Then, since the slope is negative, move down one unit and right one unit (or left one unit and up one unit, depending on the slope’s value). Repeat this pattern to draw the line. This method helps you visualize the decreasing trend of a line with a negative slope.
What Is the Significance of the X-Intercept?
Think of the x-intercept as a boat’s anchor point in the water; it shows where your line crosses the x-axis. Its significance lies in pinpointing the exact x-value where the output is zero, revealing where your line hits the x-axis. In real-world terms, this can represent break-even points, start-up thresholds, or initial conditions, helping you understand key moments or limits within a problem or situation.
Conclusion
Now that you understand how to graph lines using slope and intercepts, you’re basically a line-graphing superhero! With these skills, you can conquer any math challenge that comes your way—faster than a speeding bullet and more precise than a laser. So go ahead, draw those lines with confidence and release your newfound powers. Remember, once you master this, even the most complicated graphs won’t stand a chance against your unstoppable skills!